We have simulated the process of culmination using a hybrid cellular automata (CA)/partial differential equation (PDE) model. In the model, individual cells are represented as a group of connected automata, i.e. the basic scale of the model is subcellular. With our model we have been able to reproduce the main features that occur during culmination, namely the straight downward elongation of the stalk, its anchoring to the substratum and the formation of the long thin stalk topped by the spore head.
We conclude that the cAMP signalling system is responsible for the elongation and anchoring of the stalk, but in a roundabout way: pressure waves that are induced by the chemotaxis towards cAMP squeeze the stalk through the cell mass. This mechanism forces the stalk to elongate precisely in the direction opposite to that of the chemotactically moving cells. The process turns out to be `guided' by inactive `pathfinder' or `vanguard' cells, which form the tip of the stalk. We show that the entire development is enacted by means of the above mentioned building blocks. This means that no global gradients or different modes of chemotaxis are needed to complete the culmination.
When their bacterial food source is depleted individual amoebae of the cellular slime mould Dictyostelium discoideum aggregate to form a multicellular migratory slug, which is surrounded by a slime sheath. The slug has phototactic and thermotactic properties, which direct it to a suitable site for culmination. When it finds a good location or when time is running out, migration halts and in about 4 hours a fruiting body is formed; the fruiting body has a stalk that supports a spore head elevated above the substratum to facilitate spore dispersal.
Our theoretical understanding of Dictyostelium morphogenesis is progressing in the same way as the morphogenesis itself. Initially, the focus was mainly on the aggregation (Tyson & Murray, 1989; Nanjundiah, 1973; Parnas & Segel, 1977) and stream formation (Levine & Reynolds, 1991; Höfer et al., 1995b; MacKay, 1978; van Oss et al., 1996; Vasiev et al., 1994); more recently the mound formation and slug migration have been studied (Bretschneider et al., 1995; Savill & Hogeweg, 1997; Bretschneider et al., 1999; Dormann et al., 1998; Jiang et al., 1998, and chapters 3 and 4). So far, however, the culmination stage has received little attention.
In this paper we specifically analyse the complex cell movements that lead to the formation of the fruiting body. The processes that are incorporated in our model to describe the culmination are basically the same as those that dominate the earlier stages of the development, from aggregation onwards. These processes are cAMP signalling and cell adhesion between a small number of differentiating cell types. The dynamics observed during culmination involve stalk formation, cell movement and cell differentiation. Below we describe what is known about these processes as a result of experiments.
Very early during morphogenesis the amoebae are differentiated into two main cell types, prestalk and prespore cells. At the start of culmination the prestalk cells occupy the upper 30% of the culminant, while the prespore cells occupy the lower part.
The movement during culmination has been likened to a ``reverse fountain'', whereby the prestalk cells in the upper part form a stalk that moves downwards to anchor itself to the base, while the prespore cells from the lower part move upwards to form the spore head. The stalk moves remarkably fast through the centre of the cell mass: Sternfeld (1992) found that the tip of the stalk reached the base only about 20 minutes after penetrating the prespore region. Higuchi & Yamada (1984) found that the movement took only 11 minutes. When the stalk tip becomes anchored to the substratum, it becomes slightly thickened (Higuchi & Yamada, 1984). No lateral motion of the stalk has been observed.
The stalk is surrounded by an extracellular matrix, called the stalk tube. Its composition differs from that of the surface slime sheath in that it is much more rigid (Jermyn & Williams, 1991; Grimson et al., 1996). The tube mass is excreted by the newly recruited stalk cells: EcmB, a stalk cell-specific protein, forms part of the stalk tube (Williams et al., 1993); and when the differentiation into stalk cells is blocked, tube mass production seems to cease (Amagai et al., 1983). At the top of the stalk tube a funnel-shaped gate is formed, through which the prestalk cells enter the tube.
The tip of the stalk is surrounded by a cluster of cells. These cells are believed to guide the straight downward motion of the stalk. Hence they are called `pathfinder' or `vanguard' cells (Jermyn & Williams, 1991). The culminant also forms a basal disc, which gives the organism its scientific name, and an upper and lower cup, which surround the spore head.
Gravity plays a minor role in stalk formation. Counter-intuitively, stalk length becomes slightly shorter when gravity decreases, but there is no difference between positively or negatively directed gravity (Kawasaki et al., 1990). Normally, the stalk becomes positioned perpendicular to the substratum, independent of the orientation of the substratum with respect to the gravitational field. However, ammonia (NH3) influences the process of culmination: culminants orientate away from NH3 (Bonner et al., 1986), as well as away from each other, presumably also due to NH3 production (Feit & Sollitto, 1987).
The prestalk cells can be divided into prestalk O (PstO) cells, prestalk A (PstA) cells and prestalk AB (PstAB) cells. The PstAB cells form the upper part of the stalk, the PstA cells occupy the top 10% of the culminant, and the PstO cells occupy the lower part of the prestalk-zone. During culmination a unidirectional conversion of cell types takes place: PstO cells differentiate into PstA cells, and PstA cells into PstAB cells (Sternfeld, 1992; Williams et al., 1989). Whereas the transition of PstO into PstA cells takes place slowly and gradually, differentiation of PstA into PstAB is very rapid, and happens only when PstA cells enter the stalk tube: the cells do not express the PstAB-specific marker until they are just inside the entrance (Jermyn & Williams, 1991). The PstAB cells rapidly differentiate into mature stalk cells. During this process, the cells become vacuolated, which leads to a significant volume increase (Sternfeld, 1992; Williams et al., 1989).
However, a special group of PstAB cells develop during the slug stage. During this stage they are located in the central core at the front. These PstAB cells, which are initially present in the tip of the migrating slug, later on form the tip of the downward moving stalk, i.e. they form the above-described cluster of pathfinder cells. The remainder of the stalk consists of PstAB cells that are recruited only later, during the culmination stage. Hence the pathfinder cells are sometimes also called `early stalk cells'. Pathfinder cells look like immature stalk cells, with little cytoplasm and a large central vacuole, but apparently they do not produce tube mass (Jermyn & Williams, 1991; Sternfeld, 1992; Jermyn et al., 1996).
During culmination complex cell movements are observed. The cAMP plays a central role in the regulation of cell motion in Dictyostelium. There seems to be increasing evidence that cAMP signalling continues after aggregation is complete and organises cell movement during both slug migration and fruiting body formation (Verkerke-van, 1997). Such coordinated cell movement is organised by a combination of a pulsatile cAMP excretion and a cAMP-mediated cAMP response, accompanied by a chemotactic response towards the cAMP. Because of their high-frequency pulsatile cAMP excretion, PstA cells are considered to be the source of the cAMP waves (Kitami, 1984).
However, there is, as yet, no clue as to the stimulus that directs the downward movement of the stalk and pathfinder cells (Williams, 1997). Stalk cells neither excrete cAMP nor exhibit negative chemotaxis away from cAMP. The pathfinder cells do not seem to respond to cAMP either: during the slug stage they often disappear in the slime trail in the case of prolonged migration (Sternfeld, 1992). Nonetheless, the symmetry in upward and downward motion is striking (Williams, 1997). It seems unlikely that the pathfinder cells are able to transport the whole stalk downwards, and it also seems unrealistic to assume that the stalk cells themselves move, for they lose their motility very quickly after entering the stalk tube (Watts & Treffry, 1976). Therefore is generally assumed that the tip elongates due to the addition of stalk cells at the tube mouth (Jermyn & Williams, 1991; Thomason et al., 1999).
Not only cAMP, but also cell-cell adhesion and cell-substratum adhesion play an important role in regulating cell movements. Besides, adhesion plays a role in many other processes during all stages of the development, such as cohesion, cell sorting (a process that has been recently challenged by Clow et al., 2000), and contact-mediated regulation of gene expression. Hence in many respects adhesion is essential for normal development (Bozzaro & Ponte, 1995; Fontana, 1995).
In this study we show that the following elements are sufficient to produce all the dynamics observed during the culmination: cAMP signalling, differential adhesion, cell differentiation and extracellular matrices. We show how a stalk surrounded by a tube is formed, how its fast and straight downward motion through the cell mass takes place - without the need for any other chemical or another mode of chemotaxis -, and how eventually a globule of spores on a slender stalk develops.
In the last few years several models have been devised to describe the mound and slug stage (see, e.g. Bretschneider et al., 1999; Dormann et al., 1998; Jiang et al., 1998, and chapters 3 and 4). However, the culmination stage has hardly been modelled at all. Although Zeeman (1977) and Rubinow et al. (1981) tried to catch the shape of the culminant in mathematical equations, no dynamical model based on biological processes has yet been formulated.
The model described in this paper incorporates cell differentiation by local induction processes, cell-cell and cell-substratum adhesion, cAMP signalling with chemotaxis towards cAMP, and tube mass production. We show how these local processes and their interactions are sufficient to produce the dynamics of the culmination stage.
All the building blocks mentioned above can be very elegantly combined to interact with each other by means of the two-scale CA model-formalism developed by Glazier & Graner (1993), extended with an extra layer for PDEs (Savill & Hogeweg, 1997). In this hybrid formalism, the CA model-formalism is used to represent individual cells. They are, however, represented as a group of connected automata; that is, the basic scale of the model is subcellular. The PDEs are used to describe the cAMP dynamics.
From simplicity we have modelled the culmination using two-dimensional (2D) simulations. The simulations are considered to be transverse sections. Hence we obtain side views of the culminant. In some cases a fruiting body is seen to develop out of flattened quasi-2D slugs (Miura & Siegert, 2000), which is an extra support for such an approach. As our initial configuration we take the starting point of the final culmination, when the culminant forms a more or less hemispherical shape (Higuchi & Yamada, 1984).
In the model-formalism, cell-cell and cell-substratum adhesions are
implemented as follows. Each cell has a unique identification number,
![]() , which is assigned to the about 30 automata in the CA which
form the cell. Each cell has also a type label
, which is assigned to the about 30 automata in the CA which
form the cell. Each cell has also a type label ![]() , which
indicates whether the cell type is prespore, PstO, PstA, stalk or
pathfinder (
, which
indicates whether the cell type is prespore, PstO, PstA, stalk or
pathfinder (![]()
![]() {Psp, PstO, PstA, St, Pf}), i.e. PstAB and stalk
cells are lumped together in one cell type. Each automaton that is part of a
cell's boundary has a number of dimensionless free-energy bonds. The
magnitude of these bonds depends on the types they connect. The energy
bonds are given by
J
{Psp, PstO, PstA, St, Pf}), i.e. PstAB and stalk
cells are lumped together in one cell type. Each automaton that is part of a
cell's boundary has a number of dimensionless free-energy bonds. The
magnitude of these bonds depends on the types they connect. The energy
bonds are given by
J![]() ,
,![]() > 0. The bond energy between
a certain type and the air is given by
J
> 0. The bond energy between
a certain type and the air is given by
J![]() , A, and between a certain
type and the substratum by
J
, A, and between a certain
type and the substratum by
J![]() , S. The total free energy of a
cell is given by:
, S. The total free energy of a
cell is given by:
H + + |
(6.1) |
To describe the slime sheath and the stalk tube, two entities are
defined which follow the same rules; these can deform in the same way
as all cells but have a much larger target volume V, and hence
model-wise can be regarded as being two very large cells. This means
that the slime sheath and stalk tube have their own identification
number ![]() and type label
and type label ![]() (
(![]()
![]() {Sl, Tu}). The slime
sheath has a fixed target volume. The target volume of the stalk tube
however slowly increases due to tube mass production by stalk
cells. This is modelled by adding a fixed volume every time a new
stalk cell appears. To describe the very stiff nature of the stalk
tube, which we consider to be equivalent to the high effort required
to deform its shape, we have considerably increased the dissipation
costs (
Htubediss). Instead of varying the inelasticity
{Sl, Tu}). The slime
sheath has a fixed target volume. The target volume of the stalk tube
however slowly increases due to tube mass production by stalk
cells. This is modelled by adding a fixed volume every time a new
stalk cell appears. To describe the very stiff nature of the stalk
tube, which we consider to be equivalent to the high effort required
to deform its shape, we have considerably increased the dissipation
costs (
Htubediss). Instead of varying the inelasticity ![]() to
model such differences in stiffness, we decided to vary
Hdiss. We did this for two reasons: first of all,
Hdiss is the parameter which describes best what we
consider to be `stiffness', and secondly, the conservation of cells
constrains the permissible
to
model such differences in stiffness, we decided to vary
Hdiss. We did this for two reasons: first of all,
Hdiss is the parameter which describes best what we
consider to be `stiffness', and secondly, the conservation of cells
constrains the permissible ![]() -values.
-values.
|
J |
J |
J |
J |
J |
J |
J |
J |
J |
#cells | V | cAMP | ||||
| Psp | 15.5 | 6.5 | 9 | 13 | 13 | 25 | 10 | 8 | 10 | 20 | 11 | 1960 | 30 | relay | |
| PstO | 23.5 | 10.5 | 5.0 | 7 | 10 | 24 | 10 | 15 | 11 | 27 | 14 | 1011 | 30 | relay | |
| PstA | 31.5 | 14.5 | 7.0 | 5.0 | 3 | 16 | 17 | 21 | 12 | 33 | 16 | 79 | 30 | oscill. | |
| St | 41.5 | 18.5 | 19.0 | 19.0 | 13.0 | 3 | 7 | 21 | 3 | 43 | 20 | 25 | 30-40 | decay | |
| Pf | 29.5 | 2.5 | 0.0 | 1.0 | 10.0 | 0.0 | 11 | 7 | 5 | 35 | 8 | 14 | 30 | decay | |
| Sl | 5.0 | 7.0 | 3.5 | 11.5 | 19.5 | 19.5 | 1.5 | - | 1 | 5 | 7 | 1 | 3000 | decay | |
| Tu | 5.0 | 9.0 | 5.5 | 7.5 | 10.5 | 1.5 | -0.5 | 1.0 | - | 5 | 9 | 1 | 3×#St | - | |
|
|
|
|
|
|
|
|
|
The values for cell adhesion are given in
Table 6.1. The choice and sensitivity of these
parameters are discussed in the Results section. It is also useful to
define surface tensions in terms of the bond energies
J![]() ,
,![]() (Glazier & Graner, 1993). Surface tensions
between cell types, and surface tensions between a cell type and the
air (and, likewise, between a cell type and the substratum) are
defined as:
(Glazier & Graner, 1993). Surface tensions
between cell types, and surface tensions between a cell type and the
air (and, likewise, between a cell type and the substratum) are
defined as:
During culmination there is a rapid increase in the number of cell types that are functionally different. We have not tried to describe every different cell type, but instead we have restricted our comments to the cell types that seem to play key roles in the extension of the stalk and the formation of the spore head. We did not have to take into account the basal disc and the upper and lower cup, or the transition of prespore cells into mature spore cells.
The process of cell differentiation as described in the Introduction
is implemented in the following way: since PstA cells become stalk
cells only when they enter the stalk tube, we assume an induction
process for which cell-cell contact is necessary. This is implemented
by searching PstA-stalk cell contacts at fixed time intervals (
![]() tinduction) and by changing one PstA cell into a stalk
cell. For each PstA cell the chance that the latter will occur is
proportional to the amount of contact area. In the meantime PstO cells
change into PstA cells, which is modelled in the same way. Note that
we have used fixed time intervals to avoid instabilities in the
transitions between the cell types. A very broad range of time
intervals can be used, which affects only the height and thickness of
the stalk.
tinduction) and by changing one PstA cell into a stalk
cell. For each PstA cell the chance that the latter will occur is
proportional to the amount of contact area. In the meantime PstO cells
change into PstA cells, which is modelled in the same way. Note that
we have used fixed time intervals to avoid instabilities in the
transitions between the cell types. A very broad range of time
intervals can be used, which affects only the height and thickness of
the stalk.
After a stalk cell has appeared, it produces tube mass; this is implemented by directly increasing the target volume V of the stalk tube. And due to vacuolation the cell also increases its own volume. To model this process we slowly increase the target volume of stalk cells during the initial period following their appearance, i.e. during the first 10,000 time steps (±15 minutes when one time step represents 0.1 seconds), by 33%.
The cAMP plays a central role in our model. To describe the cAMP dynamics a discretised PDE is used with the same grid size as the CA. The cAMP can freely diffuse through all cells and through the slime sheath, but not through the tube, which is considered to be impermeable to cAMP, or into the air or substratum.
The cAMP dynamics can be described reasonably well in a quantitative
way by simplified two-variable equations of the FitzHugh-Nagumo (FHN)
type (see chapter 3). Here we use FHN-type
equations with piecewise linear `Pushchino kinetics'
(Panfilov & Pertsov, 1984):
| = | Dc |
(6.4) | |
| = |
|
|
(6.5) |
and with f (c) = C1c when c < c1;
f (c) = - C2c + a![]() when
c1
when
c1 ![]() c
c ![]() c2;
f (c) = C3(c - 1) when c > c2, and
c2;
f (c) = C3(c - 1) when c > c2, and
![]() (c) =
(c) = ![]() when c < c1;
when c < c1;
![]() (c) =
(c) = ![]() when
c1
when
c1 ![]() c
c ![]() c2, and
c2, and
![]() (c) =
(c) = ![]() when c > c2. To make the function
f (c) continuous,
c1 = a
when c > c2. To make the function
f (c) continuous,
c1 = a![]() /(C1 + C2), and
c2 = (a
/(C1 + C2), and
c2 = (a![]() + C3)/(C2 + C3). In these equations c represents the
cAMP concentration, and r the refractoriness of the cells.
+ C3)/(C2 + C3). In these equations c represents the
cAMP concentration, and r the refractoriness of the cells.
There seems to be evidence that PstA cells periodically produce the
cAMP signal and PstO cells relay the signal (Kitami, 1984). This
can be implemented in the model by giving the first cell type a
negative value of a![]() , and the second cell type a positive
value of a
, and the second cell type a positive
value of a![]() (see chapter 3). The prespore
cells also relay the cAMP signal (see Discussion).
(see chapter 3). The prespore
cells also relay the cAMP signal (see Discussion).
The response to the cAMP signal is a chemotactic movement towards the
cAMP. We incorporate the chemotactic response by using the local cAMP
spatial gradient:
![]() H
H![]() =
= ![]() H -
H - ![]() (cautomaton - cneighbour), where
(cautomaton - cneighbour), where
![]() H
H![]() is the new change in energy. This makes it more likely that an amoeba
will move towards a location with a higher cAMP concentration and less
likely that it will move towards one with a lower cAMP
concentration. Chemotaxis is only taken into account when cAMP is
above a threshold
cth = 0.05 and refractoriness below a threshold
rth = 0.2. The stalk cells and pathfinder cells do not produce or
relay the signal (Sternfeld, 1992) and they are not chemotactic
(Williams et al., 1989), which means that they are not involved in
the signalling or in the response.
is the new change in energy. This makes it more likely that an amoeba
will move towards a location with a higher cAMP concentration and less
likely that it will move towards one with a lower cAMP
concentration. Chemotaxis is only taken into account when cAMP is
above a threshold
cth = 0.05 and refractoriness below a threshold
rth = 0.2. The stalk cells and pathfinder cells do not produce or
relay the signal (Sternfeld, 1992) and they are not chemotactic
(Williams et al., 1989), which means that they are not involved in
the signalling or in the response.
The initial condition for our model is based on the following observations. When the slug halts its forward movement, the tip lifts up and the rear part crawls in underneath, and a more or less hemispherical shape is formed (Higuchi & Yamada, 1984). This is the moment that we have taken as our starting point. At this stage, the uppermost part consists of PstA cells, lower down are PstO cells, and at the bottom are the Psp cells (Williams et al., 1989). The initial core of pathfinder cells developed earlier, during the slug stage (Jermyn & Williams, 1991). We start our simulations when the stalk cell differentiation has just begun, presumably initially induced by the pathfinder cells. The stalk tube, however, has not yet formed. The stalk primordium is slightly submerged. If stalk formation were to start completely at the top, one would expect an invagination, but this is not observed. Hence it seems that cells somewhat deeper down in the culminant are involved in the prestalk-stalk transition (Watts & Treffry, 1976). Because the stalk cells produce tube mass locally, they are initially surrounded by this mass.
The open space between the cells is filled with slime mass, a worst case scenario to describe the fact that slime mass seems to be produced by all cells (Wilkins & Williams, 1995). This part of the initial condition is obviously very unrealistic. However, within a few time steps the slime spreads out over the cell mass and the slime sheath is formed. Clearly, this process of `squeezing out' the slime mass and of slime sheath formation normally happens much earlier during development.
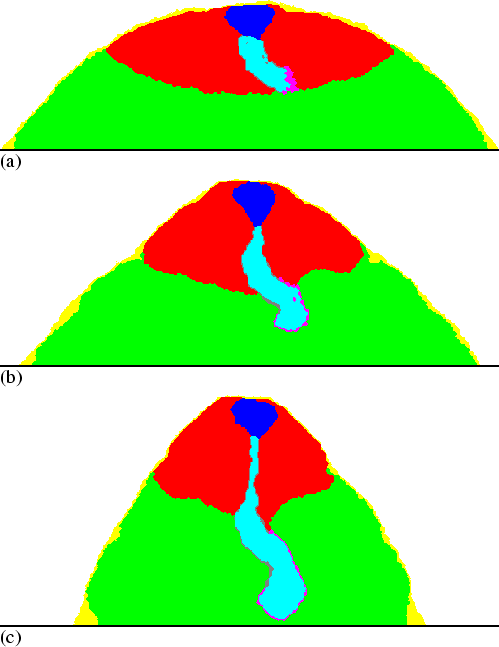
We were able to reproduce the culmination of Dictyostelium discoideum. Figure 6.1
shows a number of snapshots of the process. We have scaled the
time step and space step so as to simulate realistic values for the cAMP
dynamics. To attain the (for the slug stage) characteristic
periodicity of 2-3 minutes
(Siegert & Weijer, 1992), one time step must correspond to
0.1 seconds. To obtain a signal propagation velocity around
200 ![]() m/minute (Siegert & Weijer, 1989), one grid point must
correspond to 5
m/minute (Siegert & Weijer, 1989), one grid point must
correspond to 5 ![]() m. This scaling produces the correct timescale
for culmination and a fruiting body of the correct size: a fruiting
body about 6 mm high is formed, in about 4 hours.
m. This scaling produces the correct timescale
for culmination and a fruiting body of the correct size: a fruiting
body about 6 mm high is formed, in about 4 hours.
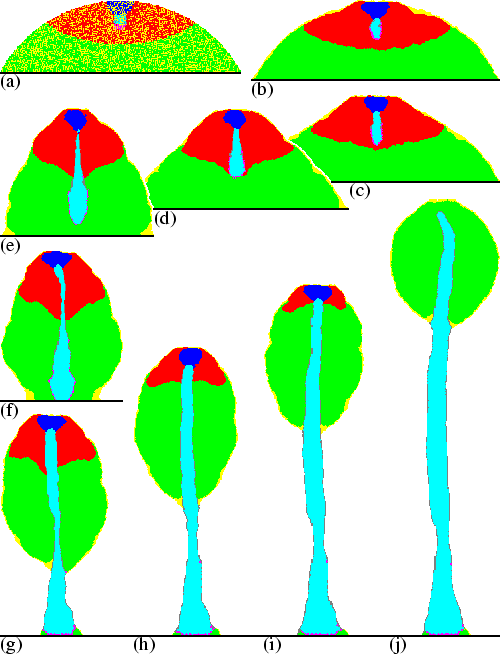 |
Within a very short time-span, i.e. within 2 minutes, the tube mass produced by the stalk cells forms a tube round the stalk cells. The stalk tip, however, does not become surrounded by stalk tube; instead it is occupied by the pathfinder cells. The tube mouth is formed at the top of the stalk. Periodically cAMP waves, originating in the PstA region, move downwards through the cell mass. These waves combined with the chemotactic response towards the cAMP lead to upward cell motion. At the same time the stalk tip quickly moves downwards, apparently `guided' by the pathfinder cells: the stalk elongation is directly perpendicular to the substratum, and the pathfinder cells continue to occupy the tip region. Within 20 minutes after passing through the prestalk/prespore interface the stalk arrives at the base. When the stalk reaches the substratum, the pathfinder cells anchor it and motion in the tip region halts. The culminant elongates upwards by continuous production of stalk cells combined with an upward motion of the spore mass. When the prestalk cell reservoir is empty, a spore head forms at the top of the stalk.
There are a number of processes which need to be looked at more closely: the formation of the tube, the fast downward elongation of the stalk, the fact that this elongation is perpendicular to the substratum, the anchoring of the stalk when it reaches the base, and the final configuration.
The stalk tube is formed very quickly. Due to strong cell adhesion between the stalk cells and weak adhesion between stalk and PstO cells, the tube mass is `squeezed' outwards, where it accumulates at the boundary between the two cell types. The tube mouth remains open, i.e. the matrix does not extend over the top, due to the continuous formation of new stalk cells and the more moderate adhesion strength between stalk and PstA cells. It does not extend along the stalk tip either, because the pathfinder cells adhere strongly to both stalk cells and PstO cells. In addition, the stiffness of the tube slows down its extension, both along the stalk tip and the tube mouth.
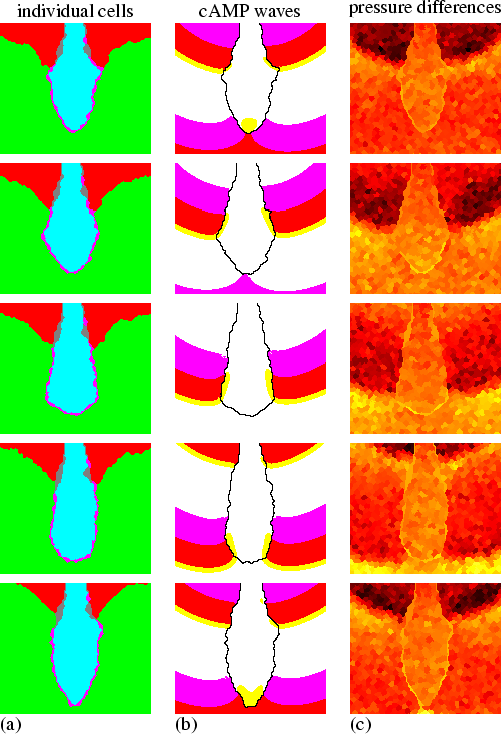
The tip of the stalk elongates faster downwards than prestalk and prespore cells move upwards, although neither pathfinder cells nor stalk cells show a chemotactic response. Instead the pathfinder cells are pushed downwards by pressure waves that accompany the cAMP waves. Figure 6.2 `zooms in' on the process of downward motion. The figure shows the cAMP waves, the accompanying pressure waves, and the response of the pathfinder cells. Although chemotactic motion occurs only at the wavefront, directed motion is not confined to this region. Because cells push and pull each other, directed motion is observed over a very large area and takes place more or less all the time (see chapter 3). A cAMP wave is always preceded by a period of low pressure, because cells are already pulled away, and is followed by a period of high pressure, because chemotactically active cells push the cell mass. The low pressure pulls the pathfinder cells outwards and the high pressure pushes them inwards again. Because the cAMP wave moves downwards, the pattern of pulling and pushing the pathfinder cells also moves downwards. This means that the pressure waves create a peristaltic motion of the stalk tip, which is comparable to the motion of the intestine. The peristaltic motion efficiently squeezes both pathfinder and stalk cells downwards. A little further up the pathfinder cells that move downwards are replaced by tube mass. At the same time, but at the other end of the stalk, newly recruited stalk cells move into the tube. These cells are transported through the tube by the combination of pushing at the tube mouth, due to the surface tension between PstA and stalk cells, and pulling in the lower region, due to the peristaltic motion.
 |
The pressure waves are created by the chemotaxis towards cAMP. As a consequence, without periodic cAMP waves or chemotactic motion there will be no peristaltic motion and no displacement of the stalk. Figure 6.3 shows a simulation without cAMP dynamics. In this simulation, the culminant does not move upwards, and the stalk does not move downwards at all. Instead the cells just form one big cluster.
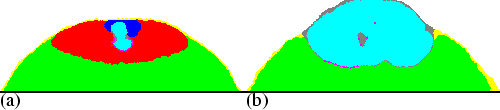 |
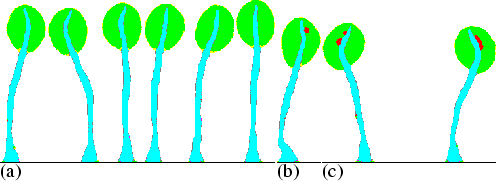
The pathfinder cells are also essential for stalk elongation. Figure 6.4(b) shows a simulation in which the pathfinder cells were omitted from the model. Now the stalk tip also becomes surrounded by the stalk tube. A kind of bag is formed due to the stiffness of the tube. The structure is filled with more and more stalk cells, but is not able to extend downwards or to keep its elongated shape. This is simply because the stiffness of the tube does not allow for any peristaltic motion. Figure 6.4(a) shows the culminant from the simulation of Fig. 6.1 at the same point of time. The stalk here does indeed extend much further.
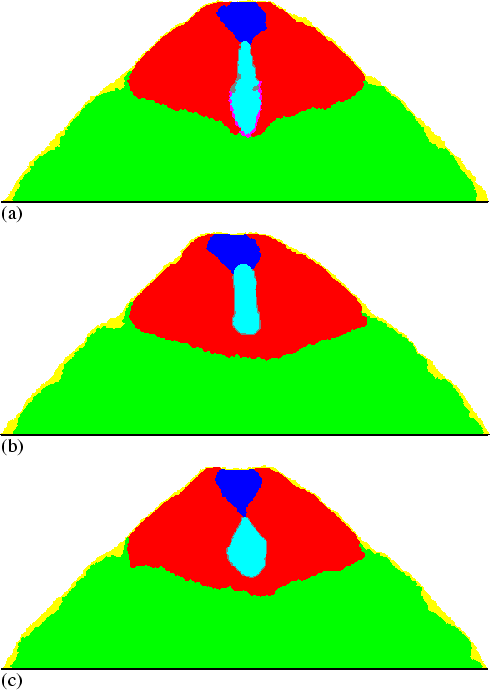 |
But even if the tube were as flexible as all other entities, no normal stalk elongation would occur. Figure 6.4(c) shows that when we simulate a flexible tube, the stalk rapidly loses its connection to the PstA region. This is due to the fact that in this case the stalk can be squeezed downwards everywhere along the tube, with the efficiency that was previously found only in the region around the stalk tip. Moreover, Fig. 6.4(c) shows that under these circumstances the stalk completely loses its elongated form. Instead, very quickly the shape becomes more or less round. This is due to the resistance created by all the cells that move upwards, which make it look like a falling drop of water. In contrast, in Fig. 6.4(a) such an effect cannot be observed. This is because with a stiff tube only the tip is easily pulled downwards; the rest of the stalk is much more resistant. Hence the stalk tip is pulled into a spiky shape. Such a shape efficiently reduces the resistance created by the upward moving cells and, in the long run, makes the whole stalk nicely elongated. The flat base of the `stalk' without a stiff tube in Fig. 6.4(c) does indeed strongly reduce the downward elongation. In conclusion, both flexible pathfinder cells and a stiff tube are needed to make the fast descent of the stalk tip possible.
Pathfinder cells are necessary not only for the downward motion of the stalk and its elongated shape, they also ensure that the elongation is precisely in the opposite direction to the upward moving cells. This is really not trivial, since an elongated structure that moves against the flow always has a very strong tendency to bend sideways.
Figure 6.5 shows a simulation in which the stalk is initially bent 90 degrees. However, very rapidly the tip turns downwards again. Figure 6.6(b) shows the final configuration of this simulation, which does not differ much from the fruiting bodies of other simulations. The mechanism can be described as follows. Normally both sides of the stalk tip are pushed or pulled at the same time. Stalk cells are transported downwards, from the region where the stalk tip is pushed to the region where it is pulled. A different situation arises when the tip no longer points downwards, for example due to the combined effect of random fluctuations and the force exerted by the cells moving upwards. Now the cAMP waves no longer move perpendicular to the stalk, but arrive at one side sooner than at the other. Consequently, at the moment one side is pushed, the other side is still being pulled. This efficiently transports cells inwards, instead of downwards, and the original orientation is restored. Note that along the side which is pushed there is also a region which is pulled, and along the other side there is also a region that is pushed. These regions, however, are not located opposite to each other, and hence this does not lead to efficient cell transport.
 |
Peristalsis also explains the position of the pathfinder cells. When more than half of the pathfinder cells happen to be positioned along one side of the stalk, the imbalance is quickly rectified. This is because downward motion on the more crowded side is more efficient and pushes the cells back to the other side. Hence the pathfinder cells always remain positioned along the tip of the stalk, yet another property which was not explicitly incorporated in the model.
In conclusion, the stalk tip always extends perpendicular to the cAMP waves, and any deviations are corrected. Since the tip of the culminant is the source of the cAMP waves, and is on top of the culminant, the stalk becomes positioned more or less perpendicular to the substratum.
Due to the mechanism described above the downward motion stops automatically: when the stalk tip reaches the base, it is no longer completely surrounded by cAMP waves, and therefore it does not move further downwards. The pathfinder cells which have not yet reached the base still have a tendency to move downwards but not sideways. Therefore, all pathfinder cells finally end up on the substratum, and the stalk tube surrounds the whole stalk. Obviously, in our model the pathfinder cells adhere quite strongly to the substratum, but this is not very important for the general behaviour.
New stalk is continuously added at the tube mouth until all prestalk cells are transformed into stalk cells. When the PstA cell type is exhausted, the cAMP waves also cease, because it is only the PstA cells that periodically produce the cAMP signal. Therefore, the moment the stalk formation is complete, the upward motion halts. After the chemotactic motion has stopped, the prespore cell mass becomes rounded, due to surface tension properties. The tube, however, is too stiff to change its general shape. Hence, in the model, a globule of spores on a slender stalk is a stable configuration.
The upward extension of the stalk is not specifically guided, and because of that some deviations in the direction of outgrowth can be observed. Figure 6.6(a) shows that due to random fluctuations during the culmination, the precise final configuration does indeed vary, but the fruiting body retains its general appearance. These two features are also observed in vivo.
 |
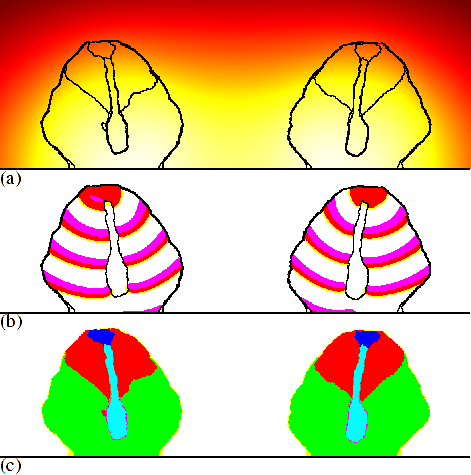
Since in our model the process of culmination is so closely related to the cAMP dynamics, it it clear that any process that changes the cAMP waves will also change the final configuration of the culminant. In chapter 4 we showed that because NH3 inhibits the cAMP-induced cAMP release (Williams et al., 1984), NH3 could play a key role in a number of tactic behaviours, especially phototaxis. Here we show that the default NH3 production by the cells and its effect on the cAMP dynamics, combined with the sensitivity of the culmination process for such modulations, can account for the well-known phenomenon of culminants orientating away from each other (Feit & Sollitto, 1987). Figure 6.7 shows a simulation in which the cells produce a small amount of NH3, which diffuses away into the air. The effect of NH3 is implemented by increasing the threshold for the cAMP response, as described in chapter 4. NH3 accumulates between the culminants, which decreases the excitability along the two sides that face each other. Because cAMP waves move more slowly at lower excitability, the waves become slanted (see chapter 3); and since the stalks extend perpendicular to the cAMP waves, they move towards each other instead of straight downwards. Therefore we end up with fruiting bodies that are orientated away from each other [see Fig. 6.6(c)].
 |
Adhesion plays an important role in the model behaviour. To reproduce
all the dynamics of the culmination, the surface tensions ![]() , as
defined in eqns (6.2) and (6.3), were adjusted
in the following ways.
, as
defined in eqns (6.2) and (6.3), were adjusted
in the following ways.
The ![]() 's between the the PstA, PstO and Psp cells are such that
they adhere to each other, but form fairly homogeneous groups. The
's between the the PstA, PstO and Psp cells are such that
they adhere to each other, but form fairly homogeneous groups. The
![]() between PstA and Psp is slightly higher so that all prestalk
cells will remain together when the end of the culmination approaches.
between PstA and Psp is slightly higher so that all prestalk
cells will remain together when the end of the culmination approaches.
By using `normal' ![]() 's between the slime mass and the various
cell types and between the slime mass and the air, whereas the
's between the slime mass and the various
cell types and between the slime mass and the air, whereas the
![]() 's between the various cell types and the air in fact are very
high, a slime sheath is formed that completely surrounds the
culminant. Similarly, because the
's between the various cell types and the air in fact are very
high, a slime sheath is formed that completely surrounds the
culminant. Similarly, because the ![]() 's between the tube mass and
the PstO and Psp cells are `normal', whereas the
's between the tube mass and
the PstO and Psp cells are `normal', whereas the ![]() 's between
the stalk cells and these cell types are very high, the stalk tube is
formed. The
's between
the stalk cells and these cell types are very high, the stalk tube is
formed. The ![]() between the stalk tube and the air is `normal',
and the
between the stalk tube and the air is `normal',
and the ![]() between the stalk tube and the slime sheath is low
(but not zero), so that the fruiting body will be surrounded by slime
sheath and stalk tube, but both matrices will not intermingle.
between the stalk tube and the slime sheath is low
(but not zero), so that the fruiting body will be surrounded by slime
sheath and stalk tube, but both matrices will not intermingle.
Because of the differences in the ![]() 's between the three main
cell types and the slime sheath, the Psp cells have a tendency to
engulf the PstO cells, which, in their turn, have a tendency to engulf
the PstA cells (Takeuchi et al., 1988). This helps as a compensation for
the decreased upward motion close to the slime sheath. Upward motion
is slower there due to some inward and outward motion, which smooths
the pressure waves. These differences in
's between the three main
cell types and the slime sheath, the Psp cells have a tendency to
engulf the PstO cells, which, in their turn, have a tendency to engulf
the PstA cells (Takeuchi et al., 1988). This helps as a compensation for
the decreased upward motion close to the slime sheath. Upward motion
is slower there due to some inward and outward motion, which smooths
the pressure waves. These differences in ![]() also ensure that the
spore head is eventually completely on top of the stalk.
also ensure that the
spore head is eventually completely on top of the stalk.
The ![]() 's between the pathfinder cells and the PstO and Psp cells
are very low, so that they can move smoothly through the cell
mass. Also the
's between the pathfinder cells and the PstO and Psp cells
are very low, so that they can move smoothly through the cell
mass. Also the ![]() 's between the pathfinder cells and the stalk
cells and stalk tube are very low, so that the pathfinder cells can
pull them downwards easily. The
's between the pathfinder cells and the stalk
cells and stalk tube are very low, so that the pathfinder cells can
pull them downwards easily. The ![]() between the pathfinder cells
and the Psp cells is lower than the
between the pathfinder cells
and the Psp cells is lower than the ![]() between the pathfinder
cells and the PstO cells, so that the pathfinder cells can move
smoothly through the PstO-Psp interface. The same is done for the
stalk tube.
between the pathfinder
cells and the PstO cells, so that the pathfinder cells can move
smoothly through the PstO-Psp interface. The same is done for the
stalk tube.
The tension between the stalk cells and PstA cells is quite high, to
ensure that stalk cells are pushed into the stalk tube, as a result of
the surface tension. Because the ![]() between the pathfinder cells
and the substratum is low, but between the stalk cells and the
substratum is high, the pathfinder cells form the base of the stalk,
and hence more or less determine the width of the inner part of the
`basal disc'.
between the pathfinder cells
and the substratum is low, but between the stalk cells and the
substratum is high, the pathfinder cells form the base of the stalk,
and hence more or less determine the width of the inner part of the
`basal disc'.
The ``reverse fountain'' is the woderful culmination of Dictyostelium discoideum morphogenesis. So far, however, no satisfactory explanation for this phenomenon has been given in the literature. Often it has simply been considered as a fact. For example, Jermyn & Williams (1991) state that the reverse fountain directs the PstA cells into the entrance of the stalk tube and that the tip extends downwards by the accretion of PstA cells at the entrance. In our model, a reverse fountain has not been defined; instead, it emerges from the local transition rules.
We have demonstrated the occurrence of the reverse fountain on the basis of (i) periodic waves of chemotaxis; (ii) flexible pathfinder cells; and (iii) a stiff tube.
We have shown that periodic chemotactic motion towards cAMP waves creates periodic pressure modulations, which move downwards together with the cAMP waves. The flexible stalk tip, which is not chemotactic, is squeezed downwards by the peristaltic motion that is created by these `pressure waves'. Because the pressure waves move in the same direction as the stalk, this process can occur much faster than normal chemotactic cell motion. The stalk tip pulls the stalk tube with it, although it resists movement due to its stiffness. New stalk cells are transported through the tube by the combined pushing at the apex and pulling at the base. Because the process of stalk elongation is so closely linked to the cAMP dynamics, the direction of the extending stalk can be maintained, and its displacement automatically halts when it reaches the base.
Hitherto, some authors have assumed that stalk elongation is due to the the fact that the stalk is pushed downwards through the culminant by the accretion of prestalk cells at the tube mouth (Jermyn & Williams, 1991; Thomason et al., 1999). However, with our model we can show that the addition of new stalk cells at the apex cannoy be responsible for the fast and straight downward motion of the stalk, due to a number of mechanical problems. First of all, pushing the stalk downwards becomes increasingly more difficult during stalk formation, because the force is exerted only on a very small surface, whereas the frictional force, which is exerted over the whole surface of the stalk, increases linearly with stalk length. Secondly, because the whole cell mass moves upwards, and the force is exerted only at the apex, the stalk will have a strong tendency to move sideways. And thirdly, if the force exerted at the apex is strong enough to let the stalk reach the base (which in our model is only feasible by simulating extremely small culminants), then the tip will simply continue to extend, even after it reaches the substratum. But because the stalk cannot move further downwards, it flips to one side, and extends laterally. Strong adhesion to the substratum does not prevent this. In contrast, the above complications are not encountered with the mechanism that we propose.
An alternative mechanism might be that the stalk is pushed downwards by nearby cells, which, during the upward motion, push off against the stalk. A similar mechanism has been proposed for slug migration (Odell & Bonner, 1986). The model-formalism we use, however, ignores the fact that forces exerted to overcome friction and to accelerate lead to similar counterforces. Implicitly we assume that counterforces are simply passed on to neighbouring cells and extracellular matrix, and spread out without influencing the local motion. However, even if this assumption turns out to be incorrect and such forces are nevertheless able to influence stalk displacement, this alternative mechanism still cannot explain why the stalk should become elongated in the first place. Nor can the mechanism account for the extremely fast downward motion, or for the correction of orientation.
In our model cAMP signalling is a prerequisite for normal stalk development and fruiting body formation (see Fig. 6.3). However, serious doubts have been expressed in the literature about whether chemotaxis continues to play a role during culmination, especially with respect to the prespore cells (Sternfeld, 1998). The alternative idea is that the growing stalk provides the force that carries the prespore cells aloft (Thomason et al., 1999). However, Watts & Treffry (1976) found that mature spores are not visible until the fruiting body reaches its maximum height, and Kitami (1984) showed that during culmination both prestalk and prespore cells are still able to exhibit a chemotactic response to cAMP. Besides, Chen et al. (1998,1995) showed that normal culmination is impaired when the rate of chemotactic motion is reduced. They showed that a chemotactic response by the prestalk cells only, or by the prespore cells only, is not sufficient for normal culmination. They conclude that prespore cells play a more active role than previously assumed.
Because the stalk tip is orientated by cAMP waves, the same processes that alter the cAMP waves should also alter the stalk orientation. The fact that culminants orientate away from each other (Feit & Sollitto, 1987) can therefore simply be due to their own NH3 production and the effect it has on the cAMP dynamics (see Fig. 6.7). Moreover, because temperature and light conditions influence the NH3 production, thermotactic and phototactic orientations can also be expected during the culmination stage (see chapters 3 and 4).
In our model a central role is reserved for cell-cell and
cell-substratum adhesion. There is a vast amount of experimental
evidence that supports differential adhesion between cell types and
between the cells and the substratum in Dictyostelium, and stresses the
importance of adhesion during development. For reviews on the role of
adhesion in Dictyostelium, see Fontana (1995) and
Bozzaro & Ponte (1995). Tuning our model has produced expected parameters
for adhesion strengths between cell types. Hence we predict that the
same relations between adhesion strengths will be found in
experiments. However, one has to bear in mind that in the model the
J![]() ,
,![]() values represent effective cell adhesions, in
which several processes are lumped together. Hence it may prove
difficult to relate them directly to experimental observations.
values represent effective cell adhesions, in
which several processes are lumped together. Hence it may prove
difficult to relate them directly to experimental observations.
We have restricted the set of entities used in our model to the ones that are needed to obtain a good description of the reverse fountain. The pathfinder cells are essential in our model. If they are omitted, then the stiff tube mass will surround the stalk tip and no peristaltic motion will be possible; a stiff bag will be formed instead of an elongating stalk. This problem cannot be solved by simply using a more flexible stalk tube (or by implementing pathfinder cells only and no tube mass, which produces more or less the same results). First of all, the stiff stalk tube has to support the fruiting body: without it the culminant will collapse. Secondly, the stiffness is needed to prevent downward motion of the complete stalk, as well as to give the stalk tip its typical wedge-like shape (as described by Higuchi & Yamada, 1984), which allows it to penetrate easily through the upward moving cell mass.
In our model we assumed a clear distinction between the PstA and PstO cells. Jermyn & Williams (1991) however showed that there is no entirely distinct class of PstO cells, but there is a discontinuous gradient in gene expression, with cells in the top one-tenth expressing the PstA marker most strongly. Because the cell differentiation seems to be a gradual process, the excitability and adhesion strengths can also be expected to change more gradually. For reasons of convenience we have modelled the cell-type transition as an instantaneous process. However, we expect that the results will still hold even if the induction process is neither instantaneous nor local, as long as the properties connected with adhesion and excitability change together. This is important because the cAMP dynamics may not be disturbed too much during the time it takes for the newly formed PstA cells to sort out to the tip, which in the model is due to the interplay between the chemotaxis and differential adhesion (see chapter 3). Hence, if there is a co-regulation between adhesion strength and excitability, this would be strong support for the mechanism we propose.
The volume increase of the stalk cells occurring due to vacuolation is not very important for the model behaviour. In contrast, Higuchi & Yamada (1984) postulated that this process must be responsible for the downward elongation. We find, however, that the volume increase has a relatively small effect. The supply of stalk cells at the stalk tip is indeed greater when volume increase is larger, which helps to increase the downward velocity. However, in the model the vacuolation can be removed completely without causing a qualitative change in behaviour.
The stalk tube seems to become even more solid when exposed to the air (Higuchi & Yamada, 1984). But even before the stalk comes in contact with the air the tube is already stiff enough for it to be located by its resistance to the passage of a fine glass needle through the tissue (Sternfeld, 1992). No gradual change in stiffness is needed in the model, and therefore we have not implemented this feature.
Neither have we implemented any processes relating to the upper and lower cup, because they are not directly needed for either elevating the cell mass or preserving the final shape of the fruiting body. And we observe in the model that even if there is no specific cell type connected to the basal disc, something comparable is nevertheless created, with a core formed by the stalk tip, and an outer ring formed by `rearguard' cells that are left behind.
However, some of the above processes that are not essential for the culmination as described above could play all kinds of other roles during the development. For example, it could very well be that the turgor pressure of the highly vacuolated cells contributes to the maintenance of the final stalk structure (Watts & Treffry, 1976).
In our simulations we do not find the typically observed extended shape of the tip. We expect that this specific form of the tip is a three-dimensional (3D) property, caused by 3D scroll waves, and hence cannot be depicted in our 2D simulations. Such scroll waves have been found to organize the tip region during the slug stage (Siegert & Weijer, 1992). Scroll waves may also explain the early formation of the stalk primordium, because in the core of the scroll wave one finds a permanently low cAMP concentration (Siegert & Weijer, 1992), and during the slug stage low cAMP levels are needed to induce differentiation into pathfinder cells (Berks & Kay, 1990).
Finally, there is also another consequence of performing 2D instead of 3D simulations. Because the stalk is much narrower than the prestalk area that forms it, the stalk can become very long. However, due to scaling properties, this effect is quadratically larger in 3D than in 2D. Hence, to produce a fruiting body of normal height in 2D, the culminant must be initially four times as broad.
The mechanisms described here not only generate the dynamics that are directly connected with the unfolding of the reverse fountain, but, as a side-effect, they can also give rise to a number of seemingly unrelated features. Nevertheless, many of these features are observed in experiments. Thus, in our model, no extra assumptions are needed to explain such features.
Harwood et al. (1992) showed that when the differentiation of PstA cells into stalk cells is blocked, and hence no stalk is formed, the culminant continues to extend. This process goes on and on, and eventually the culminant becomes an erratic hair-like structure, which collapses onto the substratum. In our model, we can perceive the same kind of behaviour because the upward motion is due to chemotaxis - not to stalk extension, as previously assumed (Thomason et al., 1999) - and because the upward motion does not stop, due to the fact that the PstA cell pool is never emptied and hence cAMP waves keep on being produced.
Kitami (1985) showed that when a culminant is exposed to a centrifugal force of 40-50 G, hardly any cell mass can culminate (it remains shaped like a mound). When a cell mass did not culminate, it did not form a normal stalk. This one-to-one relation between upward motion of the cells and downward motion of the stalk (see Fig. 6.3) logically follows from the mechanism we propose.
In our model, the mechanism that corrects the direction of elongation does not work if we start with a small isolated cluster of cells: the cells form a rounded mass, show no efficient peristaltic motion and are pushed sideways by the upward moving cells. This corresponds to the description that Sternfeld (1992) gives of the small clusters of early stalk cells that are formed during the late slug stage: sometimes 25-50 cells separate, expand a little and attain a surface position before they finally reach the rear of the slug.
We also observe a constriction at the base of the prespore zone before the stalk reaches the substratum. In our model, this is simply due to the combination of adhesion and upward motion. Neither a spiralling motion nor a contractile event at the surface of the cell mass is required to produce this constriction (Chen et al., 1998, suggested that these factors might be needed to explain the constriction).
After the stalk tip reaches the base, the stalk becomes slightly thickened, as observed by Higuchi & Yamada (1984). If we look at the final configuration, with the globule of spores on a slender stalk, we see that the spore head is still enclosed by the slime sheath, both in our simulations and in vivo. This may indeed be important for holding together the mass of spores (Watts & Treffry, 1976), but no `new' features are needed. The stalk is surrounded by the stalk tube, but the tube mass neither envelops the spore head nor the cells that are left on the substratum, again as in vivo (Watts & Treffry, 1976).
And finally, Sternfeld (1992) found that the outer ring of the basal disc consists only of a single layer of rearguard cells: the major portion of the basal disc is formed by the downward moving stalk. In our simulations, a basal disc-like shape is formed, with an outer ring of cells that fail to move upwards with the mass of prespore cells. To obtain this behaviour we do not have to define basal-disc cells or rearguard cells.
In this study, we have largely ignored the genetics and detailed regulatory mechanisms of Dictyostelium discoideum. As a result, our model allows us to pinpoint those elements that are essential for the successful formation of a fruiting body: we have shown that the whole process can unfold in a minimal model with fixed parameters. Nevertheless, it is known that many genes are up and down regulated during culmination, and research in the near future is likely to reveal much more about the high number of genes involved. If one wants to relate gene knowledge to this model, it is important to take the following points into consideration. First of all, many of these genes are connected to processes not directly related to the cell movements, such as, for example, the maturation of spore cells. Nevertheless, a large set of genes is needed for each process that we have described in the model. And these processes must be fine-tuned, which again requires a number of genes. Moreover, all processes have to be operational under many different circumstances. Therefore, by evaluating the role of those genes that are involved in cell movement in the light of our model, one should be able to generate interesting insights into evolutionary refinements of the culmination process, as well as into genetic robustness and redundancy. Finally, because the model is completely defined at the (sub)cellular level, whereas the mechanisms at work are on larger scales, one can begin to understand how gene expression can govern macro-level phenomena. For example, using this model it should be feasible to interpret the aberrant phenotypes that are created by restriction enzyme-mediated integration (REMI) (Smith, 2000).
We have used the hybrid CA/PDE model-formalism, because this formalism can describe the interaction between signalling, adhesion, pressure, pushing and pulling in a very elegant way. Our explanation for the dynamics during culmination is based on the interactions of these processes. These processes are the same as those which play the central role during the earlier stages of the development: here we have described the culmination, but previously we have used the model-formalism to explain how single amoebae aggregate into a mound, which eventually leads to the formation of the slug (Savill & Hogeweg, 1997). Later on we used the same formalism to unravel the mechanisms behind the thermotactic and phototactic properties that direct a slug to a suitable site for culmination (see chapters 3 and 4). Thus, we now can describe all the stages of the morphogenesis with one formalism. In summary, our model of the culmination of Dictyostelium discoideum culminates the modelling of its development.
 ,
,
